Advertiser
Socials To Sales · the ads they run
Socials To Sales runs 573 creatives on 111 pieces of copy. Everything below is counted from their own ads, as Meta publishes them · what they wrote, what they showed, when each one started. Nothing here is inferred.
Free account · no card

Operating from
United States
Creatives recorded
573
Every ad we hold
Distinct hooks
111
5 creatives per hook, on average
Longest run
130d
Started November 2025
New in 30 days
0
Creatives with a start date in the last month
What they keep repeating
Socials To Sales runs 573 creatives on 111 different pieces of copy. These are the ones they reuse most · the wording is theirs, quoted as it ran.
“If you're like most business owners on Instagram, you probably feel like you're stuck on a hamster wheel. You're posting every day, chasing trends, maybe even going viral occasionally. But n…”
115 creatives · first ran November 2025
“If you're like most business owners on Instagram, you probably feel like you're stuck on a hamster wheel. You're posting every day, chasing trends, maybe even going viral occasionally. But n…”
94 creatives · first ran February 2026
“How long has your coaching or consulting business been on a financial rollercoaster? You’ve been hovering around £8k-£10k a month... Which is good but for some reason you can’t shake the fee…”
81 creatives · first ran April 2026
“If you're like most business owners on Instagram, you probably feel like you're stuck on a hamster wheel. You're posting every day, chasing trends, maybe even going viral occasionally. But n…”
55 creatives · first ran October 2025
“Last month, our social media strategy brought in $82k. You don't need complex methods, what you need is content that converts, a funnel that filters leads, and daily support. We've simplifie…”
50 creatives · first ran July 2025
Their most recent creatives
The newest distinct visuals we have recorded, with how long each has been running.
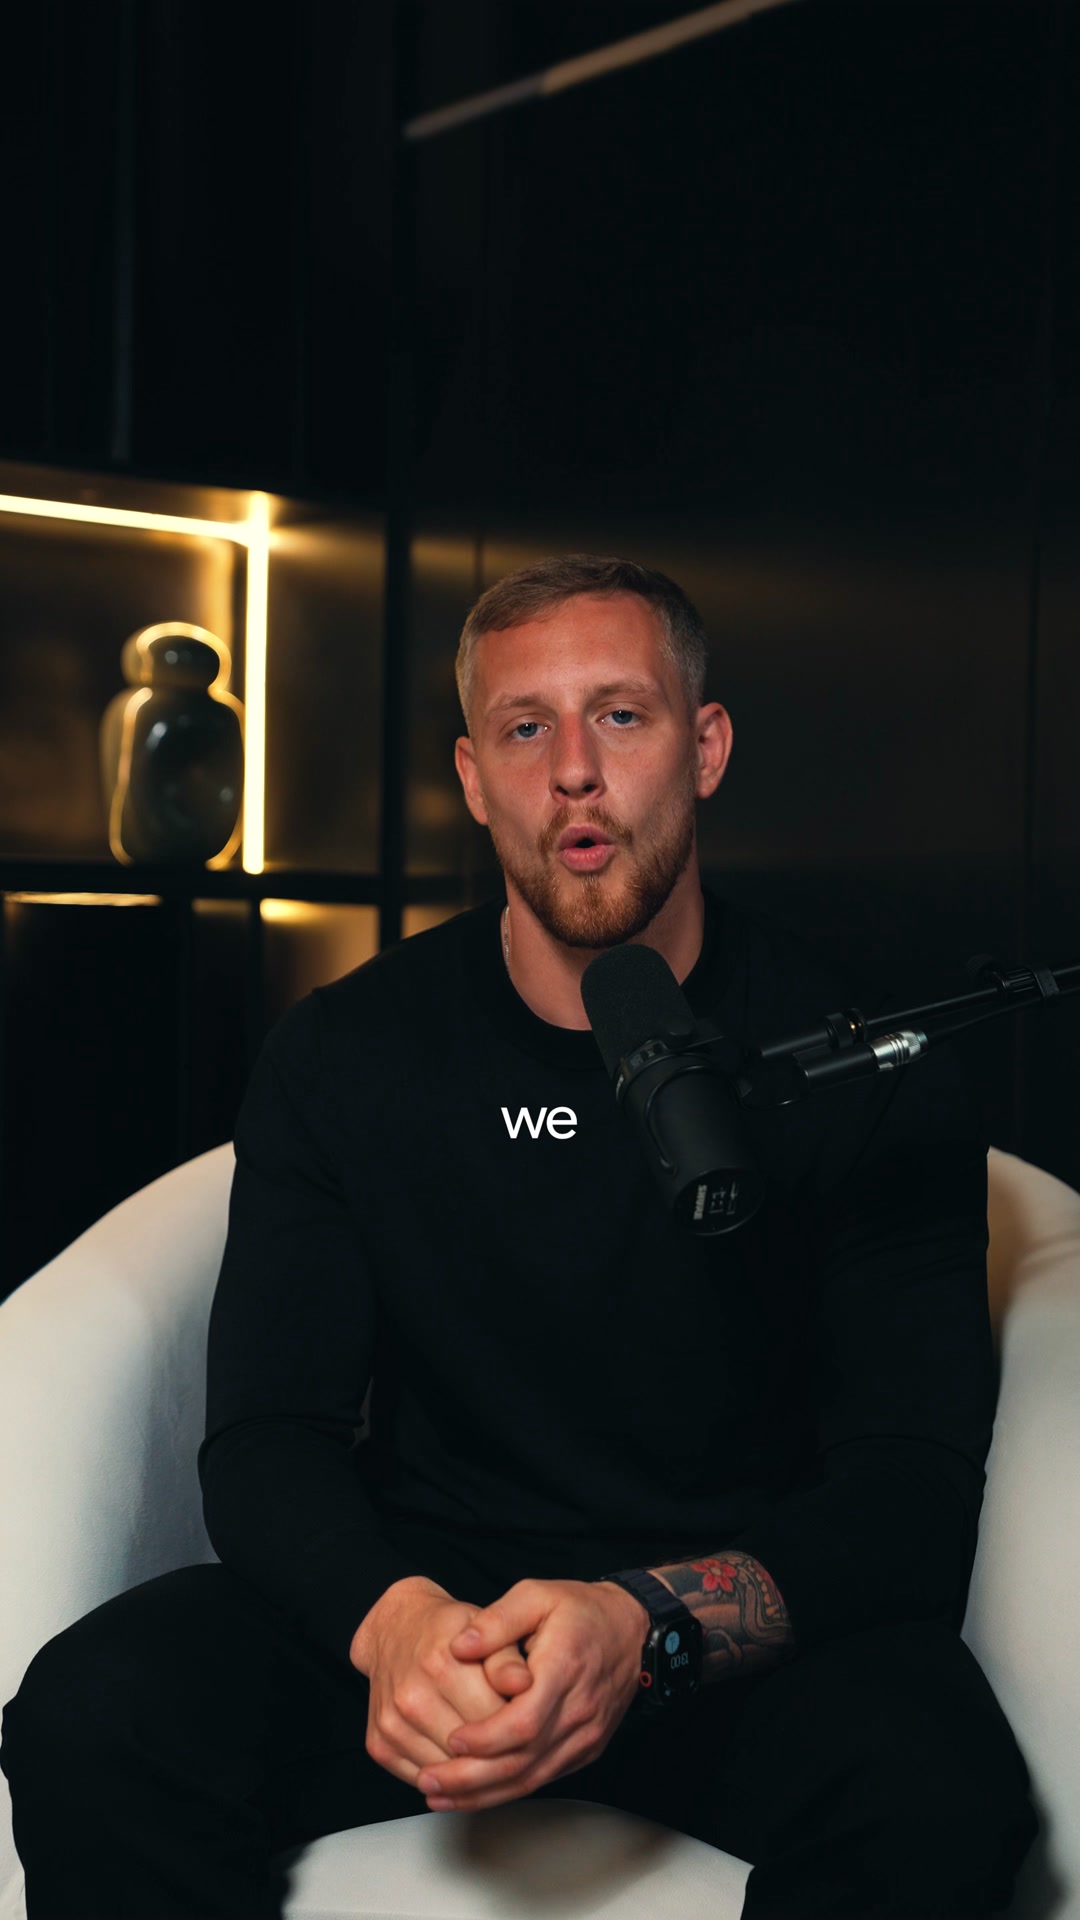
38d · June 2026
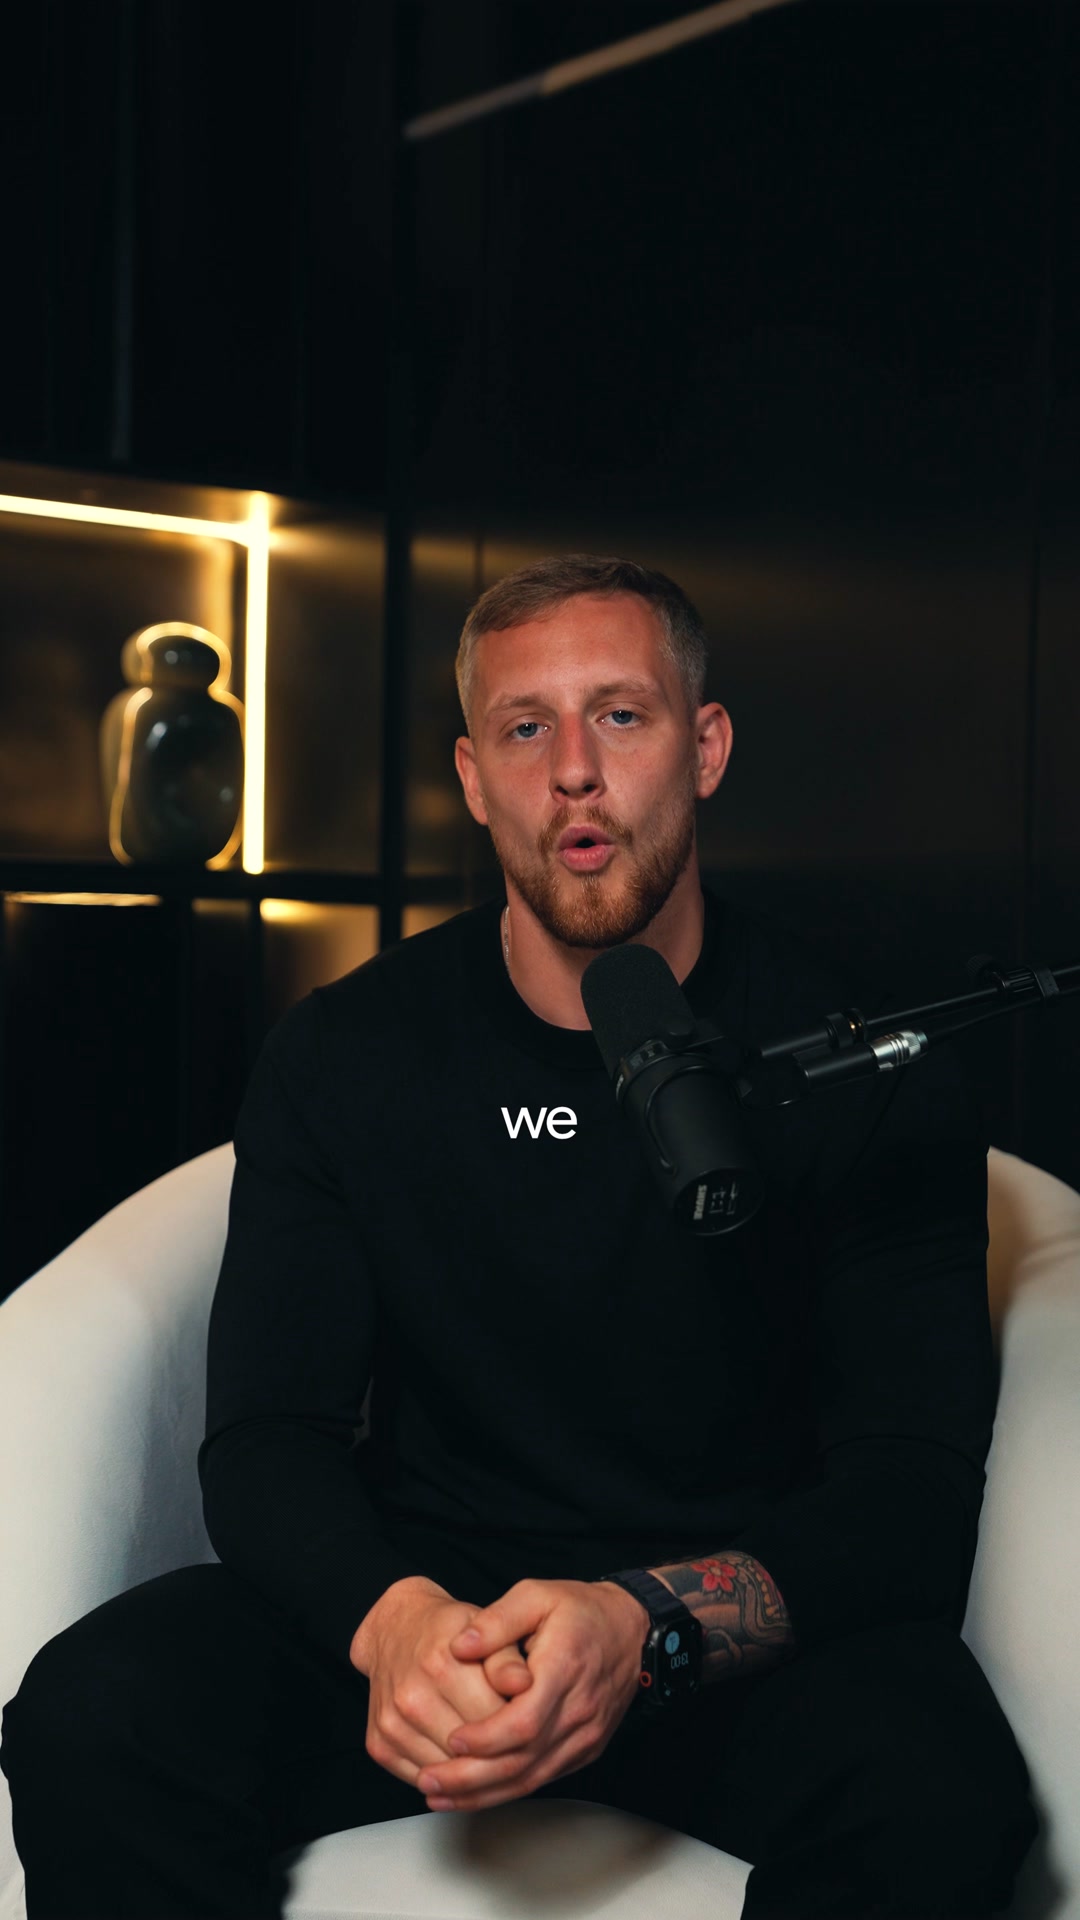
38d · June 2026
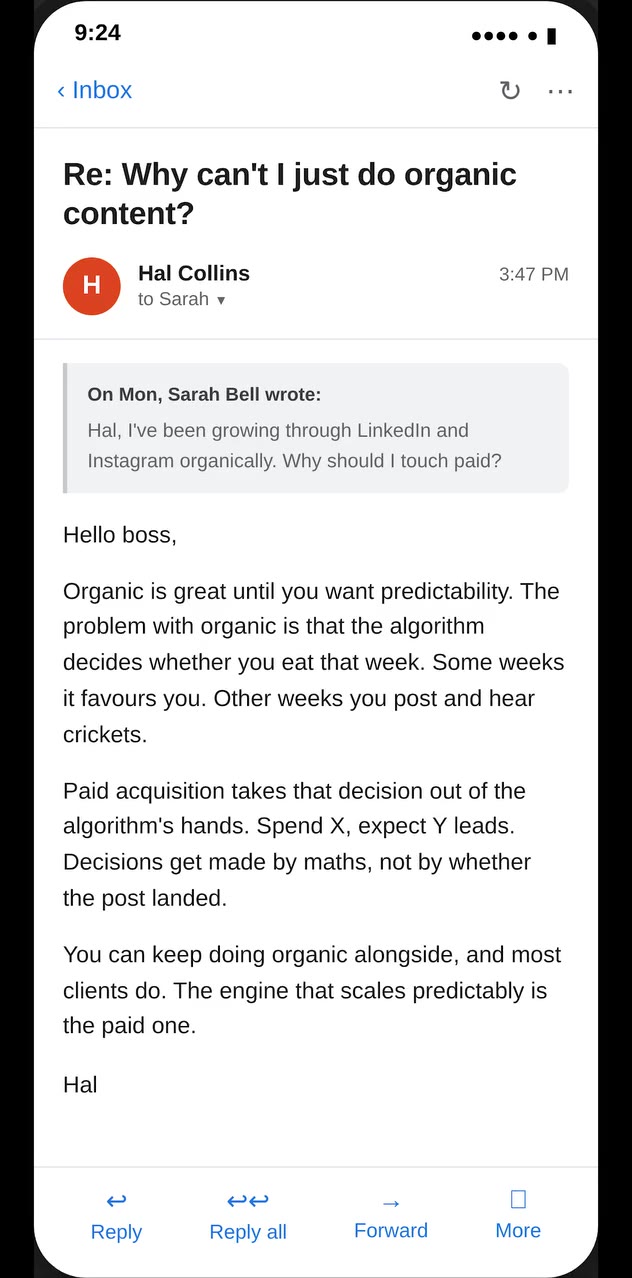
5d · June 2026
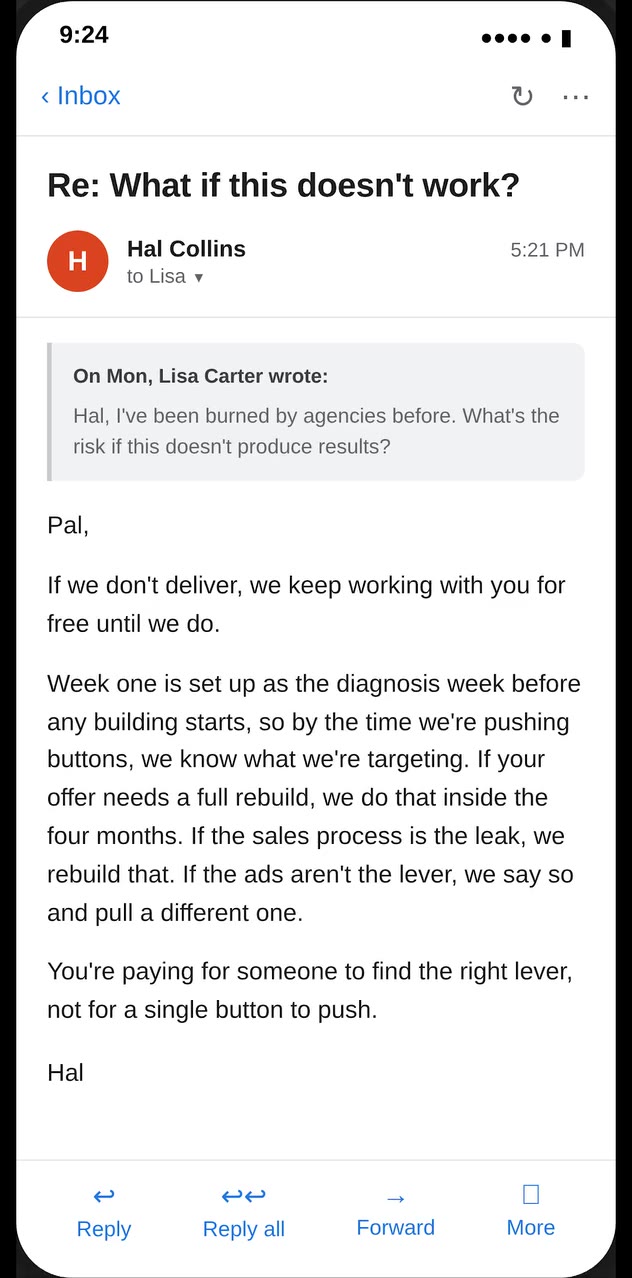
1d · June 2026
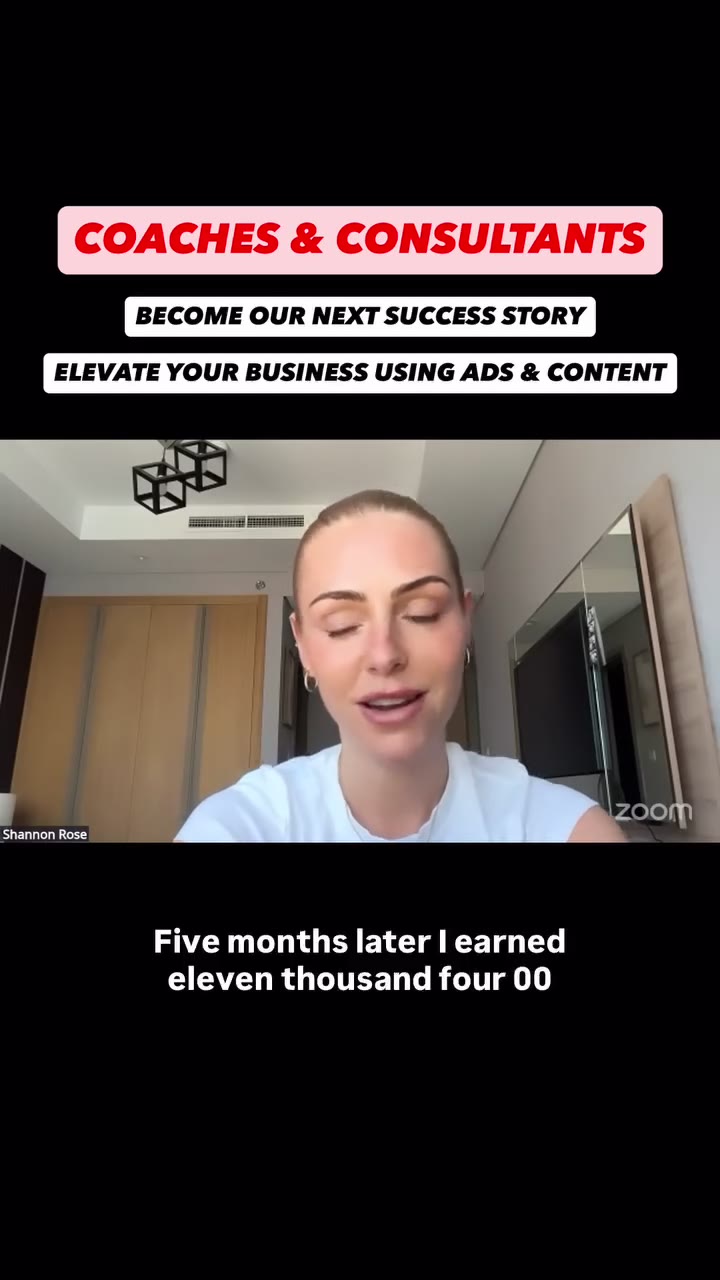
5d · June 2026
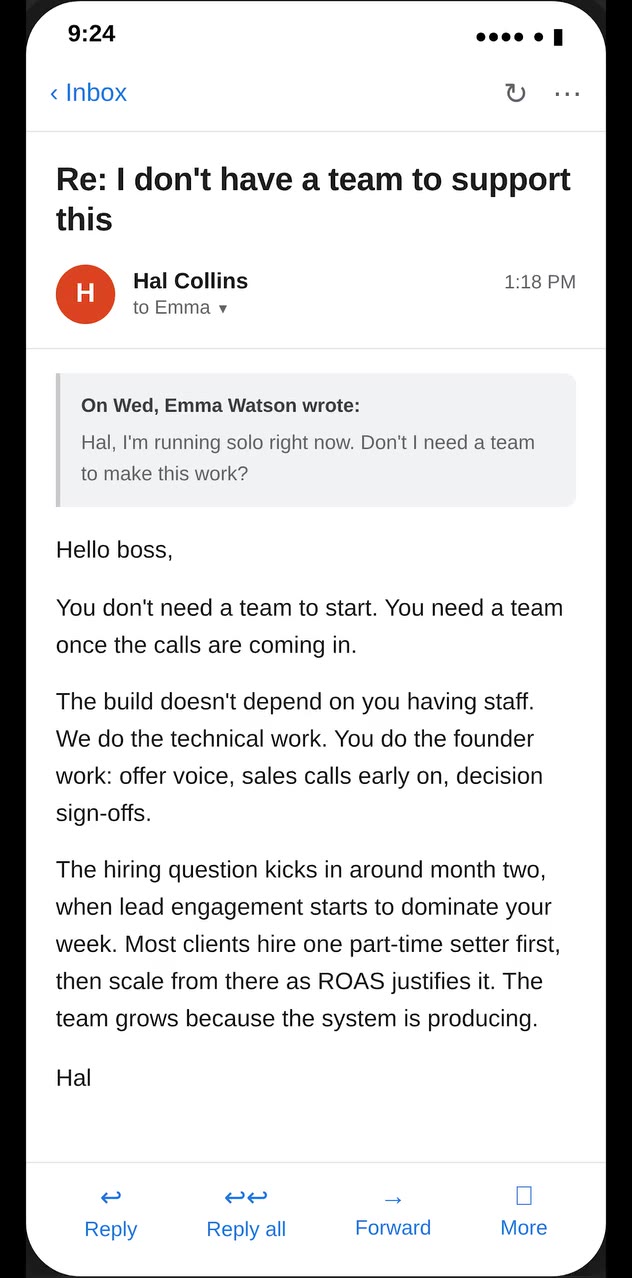
0d · June 2026
Who their ads reached in Europe
Published by Meta under the Digital Services Act, so it is measured rather than modelled · 14 of their ads carry a breakdown. Everything below is a share of their EUROPEAN reach, not of their total audience: Meta publishes this for the EEA and nowhere else.
Age and gender · EU reach only
41% women · 58% men
women men and unspecified
Which EU countries
- United Kingdom100%
Shares of European reach only, not of their total audience · Meta publishes this breakdown for the EEA and nowhere else, so an advertiser can do most of their volume outside Europe without any of it showing here. Counted across 14 ads that carry a breakdown, 84,385 people reached in the EEA.
Behind the wall
You are seeing 6 of 573 creatives, and none of what sits behind them
- Every creative, searchable and filterable573 recorded
- The page each ad sends people to
- The funnel behind it, step by step
- The stack running it, where we can detect it
- Alerts when they launch something new
Other coaching business advertisers in United States
Same market, same country · the people this one is actually competing with for attention.






Questions people ask about this page
- Where does this come from?
- Every figure is counted from ads Socials To Sales ran on Meta, collected from the public ad library. The copy is quoted as it ran and the dates are the ones the ads carry. Nothing on this page is estimated, modelled or bought from a third party.
- Are these ads running right now?
- We cannot say that, and we do not. Meta closes an ad record when it stops, so what we can establish is when a creative started and how long it ran, not whether it is live at this second. Anyone claiming otherwise from this data is guessing.
- Is this every ad they have run?
- No. It is what has been advertised publicly and collected, which makes every count a floor rather than a census.
- How do I see the funnel behind these ads?
- That part sits behind an account. This page publishes what the ads themselves say; the funnel each one opens, the stack running it, the offer and its price are what the product opens.
Knowing what Socials To Sales writes is the easy half
What sits behind the ad · the funnel it opens, the stack running it, the offer it sells and what that offer charges · is the half this page does not show. That is what the product opens.
Where these numbers come from
Every figure on this page is counted from ads collected in the Meta ad library, and nothing is inferred: the copy is quoted as it ran, the dates are the ones the advertiser's own ads carry. Ad counts are a floor rather than a census · we hold what has been advertised publicly and collected, not everything that ever ran. Nothing here says an ad is live right now, because that is not something this data can establish · Meta closes the record when an ad stops, and our own collection runs weekly, so the honest statement is when a creative started and how long it ran. The most recent creative here started Jun 16, 2026.
Last measured Sep 10, 2026.